Projects published to Bolt Hosting on a paid plan include built-in analytics to let you view traffic to your published site.
With Bolt analytics, you can track unique visitors, pageviews, top pages, and bandwidth usage.
You can also see top traffic sources, visitor locations, and a list of top “not found” (404) pages, which helps you know when people are trying to visit pages that don’t exist.
Analytics data currently includes visits and actions from web crawlers and bots. At this time, there is no built-in way to separate crawler traffic from visits by real users. This means that reported page views, sessions, and other engagement metrics may be higher than actual human activity.
View your analytics data
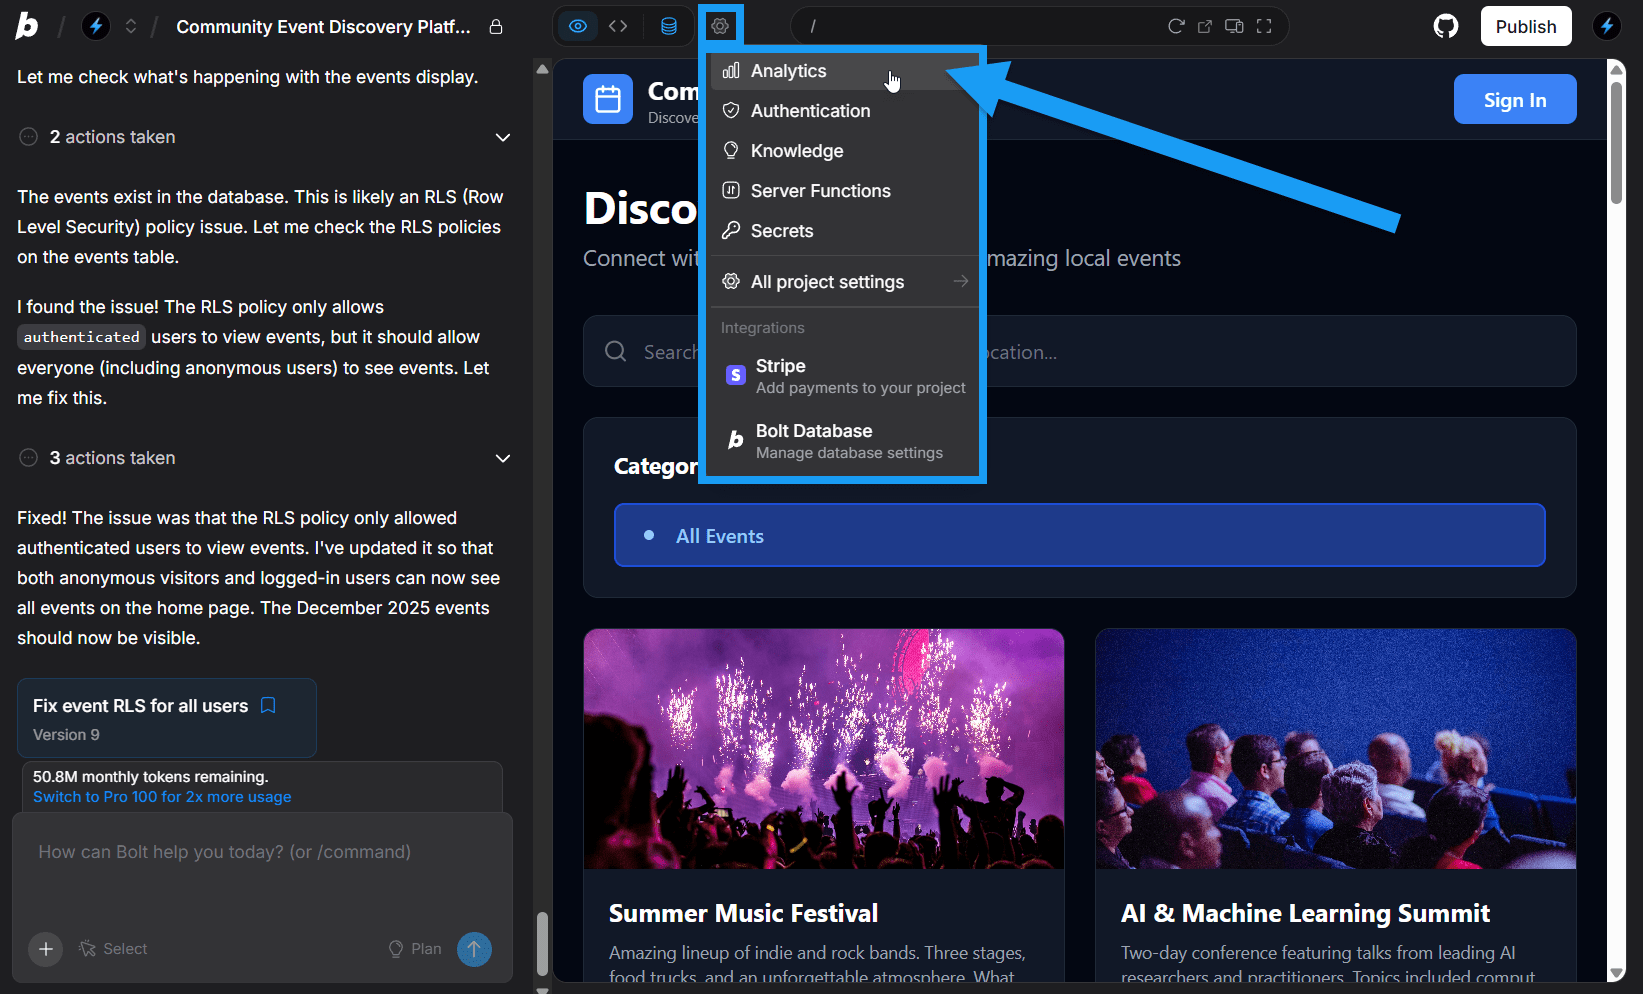
To view your hosting analytics data, follow these steps:
- Log in to your Bolt project.
- Click the gear icon in the top center of your screen.
- Click Analytics.
Filtering analytics data
You can view data up to the last 30 days. Use the Day, Week, or Month buttons in the top-right of the Analytics view to change the timeframe.
Using third-party analytics
You can add extra analytics to your site with services like Google Analytics or Matomo by embedding their tracking code. In Bolt, you can either switch to Code view and paste the code in the desired location yourself or use the chatbox to prompt Bolt to add it for you.
Check your analytics provider’s documentation for tips on where to place the code and best practices.